ABSTRACT in my word
越来越多的app使用native来实现一些核心的功能,虽然已经有一些针对Android Native代码的研究,但是覆盖率都不是很好。为了弥补这个不足,论文利用了ARM平台ETM(Embedded Trace Microcell) 的硬件特性以及Android 内核的eBPF来记录程序运行轨迹以及一些关键的内存数据,方便进行代码审计。
传统的Android native分析需要依赖于Debugger, DBI 框架以及模拟器,然而这种分析方式存在难以解决的问题:
运行在模拟器上的代码与真机上的代码存在差异,可能会产生漏报;
DBI框架会引入可识别的库/代码进入目标进程、模拟器会有一些与真机不同的配置文件;这些特征极易被
anti-analyze识别;DBI框架会导致程序运行开销变大,也很容易被识别到;
论文主要的贡献如下:
提出了一种新型高效的分析框架
NCScope, 而且代码开源:为NCScope设计了新的方法来检测
self-protection和anti-analysis方法,并通过从收集的指令轨迹和内存数据中恢复运行时的函数调用和数据流来诊断本地代码的内存损坏。
Directory
Background : 分章节介绍ETM机制以及eBPF机制;
Overview of NCScope : 整体介绍NCScope的架构;
way to tracing instructions;
way to collect memory data;
Analyze module of NCScope : 介绍目前NCScope目前具备的分析检测能力;
Recovering Runtime Function Calls
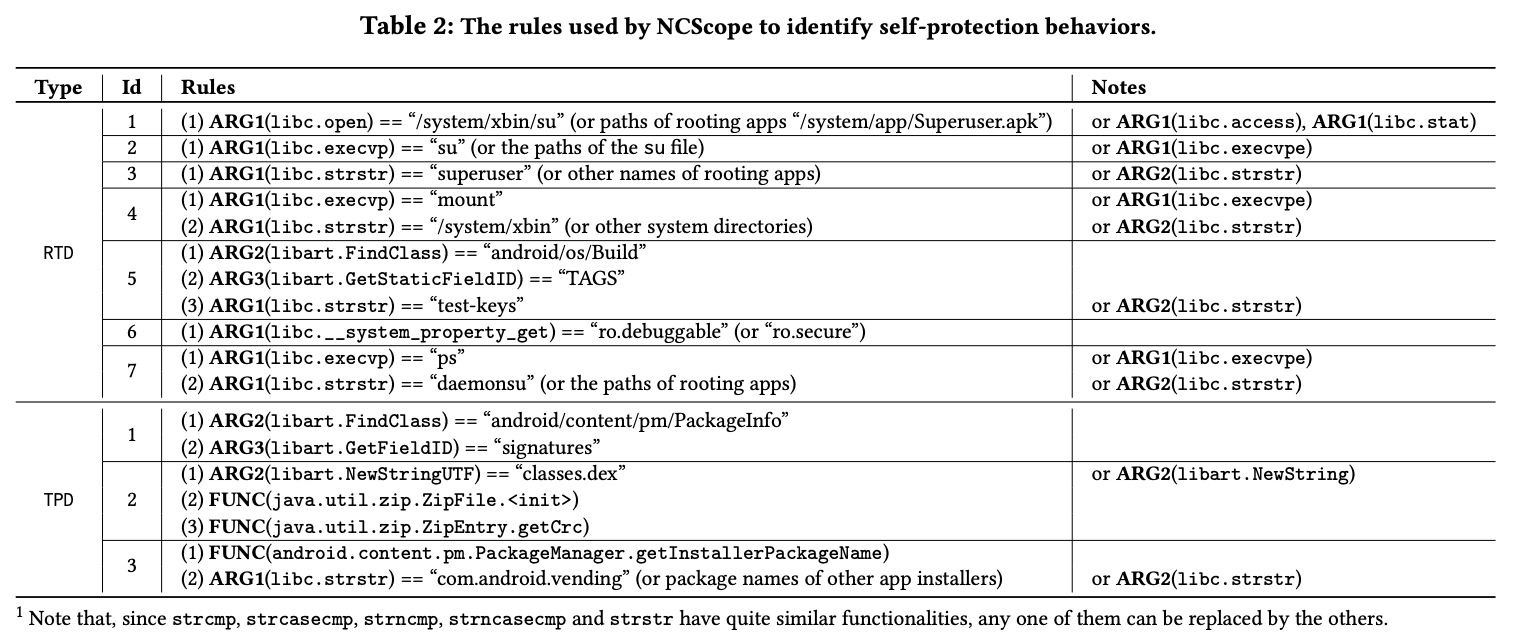
Detecting Self-Protection Methods
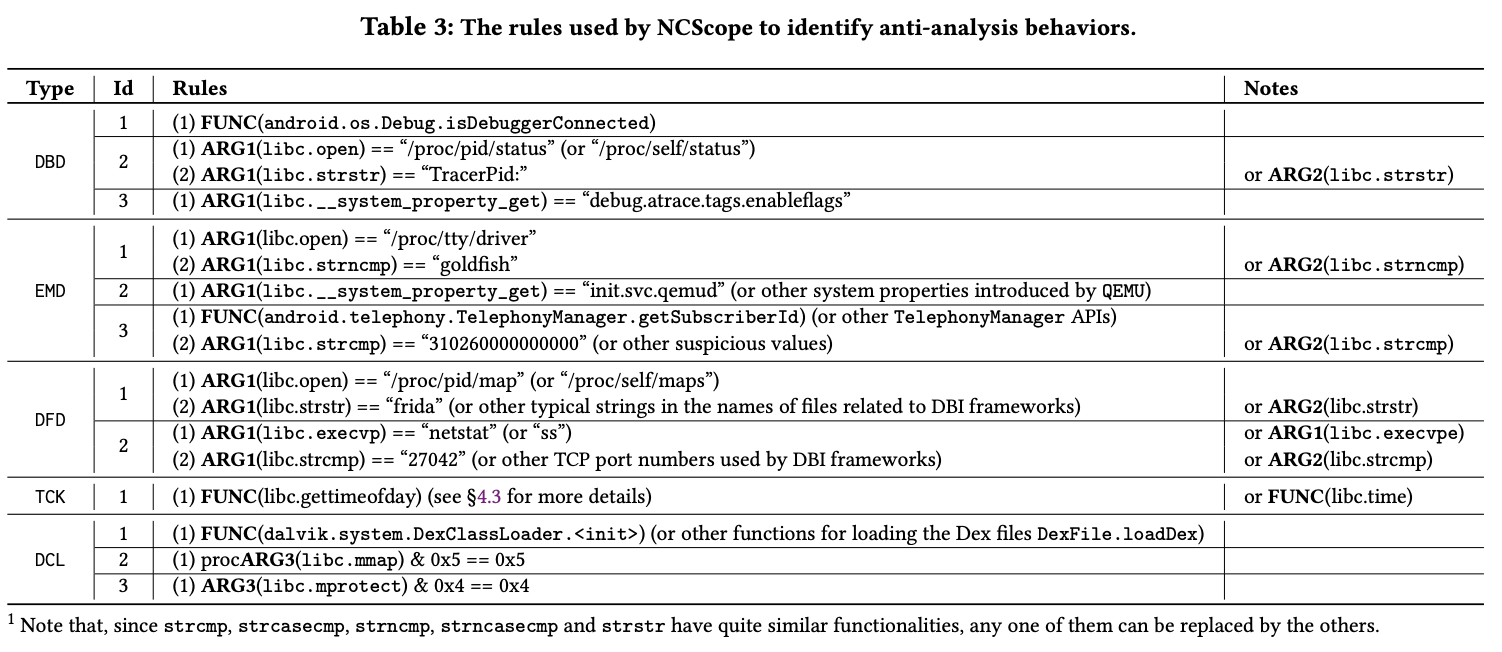
Detecting Anti-Anaysis Mechanisms
Diagnosing Memory Corruption Bugs
Extending NCScope.
EVALUATION : 一些测试数据结果展示,主要关注以下几个方面:
- How is the overhead incurred by NCScope?
NCScope introduces very small additional overhead to the execution of app under analysis.
- How prevalent are self-protection behaviors implemented in native code of financial Android apps?
NCScope can precisely identify the app’s selfprotection behaviors in native code. It finds that only 26.8% of the evaluated financial apps implement self-protection methods in native code, implying that their security is far from expected.
- How prevalent are anti-analysis behaviors implemented in native code of Android malware?
NCScope can precisely identify anti-analysis behaviors in native code. It finds that at least 78.3% of the evaluated malware implements anti-analysis methods in native code.
- Can NCScope assist the diagnose of memory corruption bugs in the app’s native code?
NCScope can aid memory corruption diagnosis by identifying use-after-free and double-free in native code
- Can NCScope assist the analysis on the performance of the app’s native code?
NCScope can aid performance analysis on native code by collecting the accurate data with little noise.
My Key Notes
3-2 内存数据的采集与存储
【采集过程 : Retrieving Memory Data】重点会关注一些关键的系统调用被触发时机的参数,由于大部分的参数都是指针;因此使用内核中的PT_REGS_PARM*宏来获取到base address然后再读取具体的参数内容;
【数据存储 : Storing Memory Data】eBPF生产出来的数据会被存储在内核的虚拟内存中;由于大部分的系统调用都是通过一些基础的动态链接库来完成的,为避免非目标APP的调用产生无用的数据,eBPF program会利用记录调用的PID以保证仅记录目标APP的调用;为了能够后期判断调用的先后顺序,会给每次调用记录添加一个时间戳方便后续根据执行流在做分析。
4-1 恢复函数调用
首先构建从每个指令地址到相应系统函数的映射,以确定应用程序从追踪的指令流中调用的系统函数。
从构建的映射中,根据存储在ETM流中的地址元素找到应用程序所调用的系统功能
根据调用流程中是否带有
JNI_onLoad等函数,可以判断调用来源是应用层或是native层
上述部分有详细的解析原理说明,详见论文
4-5 data_flow恢复与漏洞检测
利用NCScope记录的运行时数据,驱动离线的符号执行可以恢复数据流以及检测一些UAF,double free等漏洞,其中,通过eBPF hook native code的初始化函数能够较好的构造符号执行环境;
4-2 检测root环境代码的检出方式
4-3 Anti-Analysis的代码检出
RELATED WORK
JN-SAF : statically analyze the native code to discover data leakage, command execution, and JNI reflection.
DroidScope [98], CopperDroid [87], AndroidPerf [92], NDroid [93], and others [54] are built upon QEMU
DroidTrace [99] and Malton [95] use ptrace and the DBI framework Valgrind [76], respectively, to analyze apps.
Ninja [77] and Happer [94] use ETM to trace apps and hardware breakpoints to retrieve memory data
REFERENCE
感谢G.O.S.S.I.P推荐的优秀论文,以及参与论文工作的各位老师